Chapter 10 - The Rule Inspector
The Rules pane shows the rules of one field, button, or load event at a time. The Rule Inspector shows all of them at once, across every data source, in a searchable tree. Use it to answer "where is this field set?", "what runs when this changes?", and "is anything broken?" before you publish.
10.1 Opening it
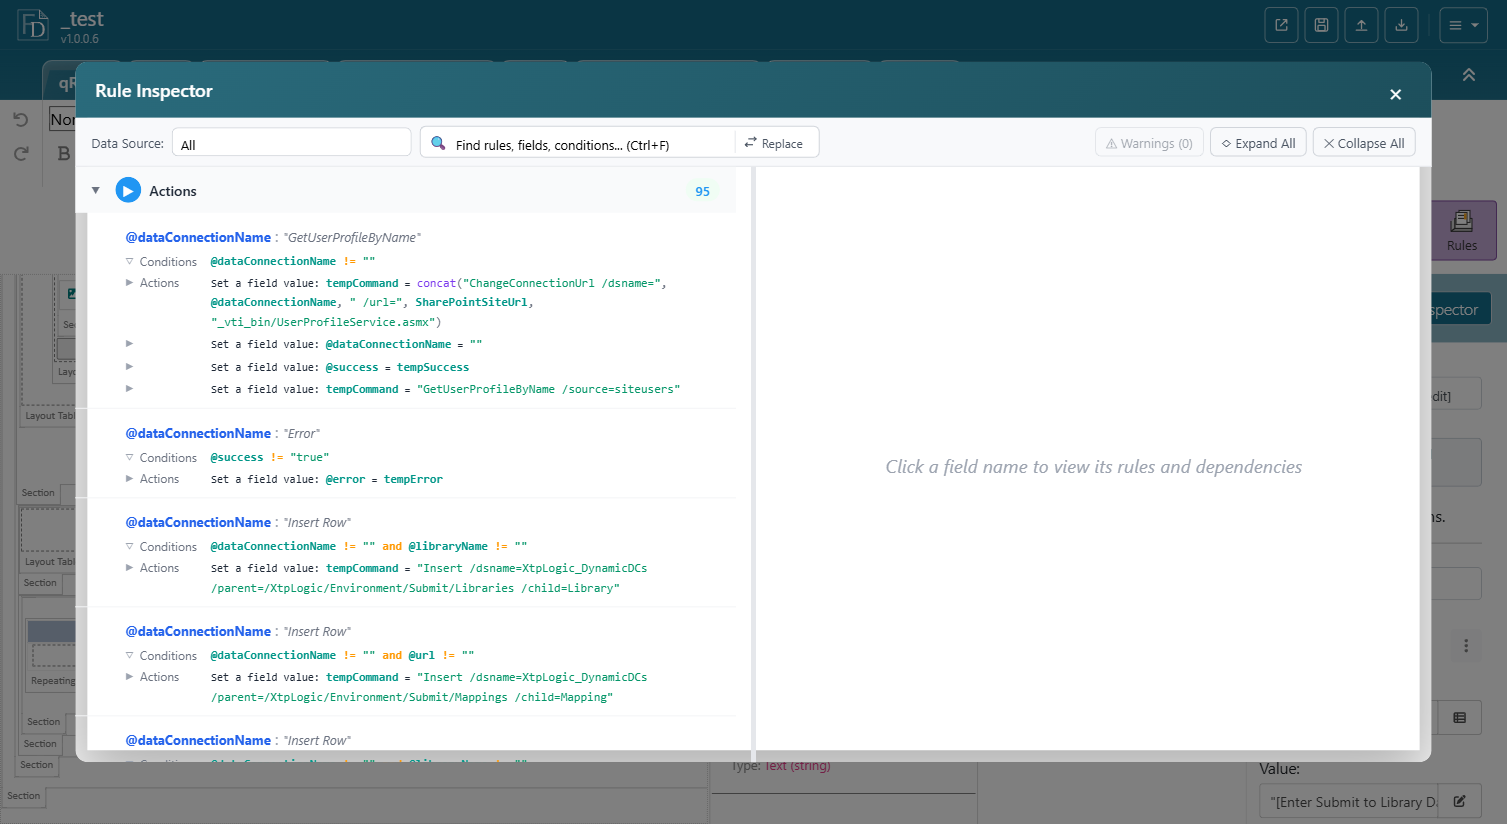
Click Rule Inspector in the header of the Rules pane, or the button of the same name on the Form ribbon tab. It opens as a full-width dialog.
10.2 Layout
| Element | Purpose |
|---|---|
| Data Source dropdown | Limit the tree to Main or one secondary data source (QdabraRules, XtpLogic_DynamicDCs, ...). Default: All. |
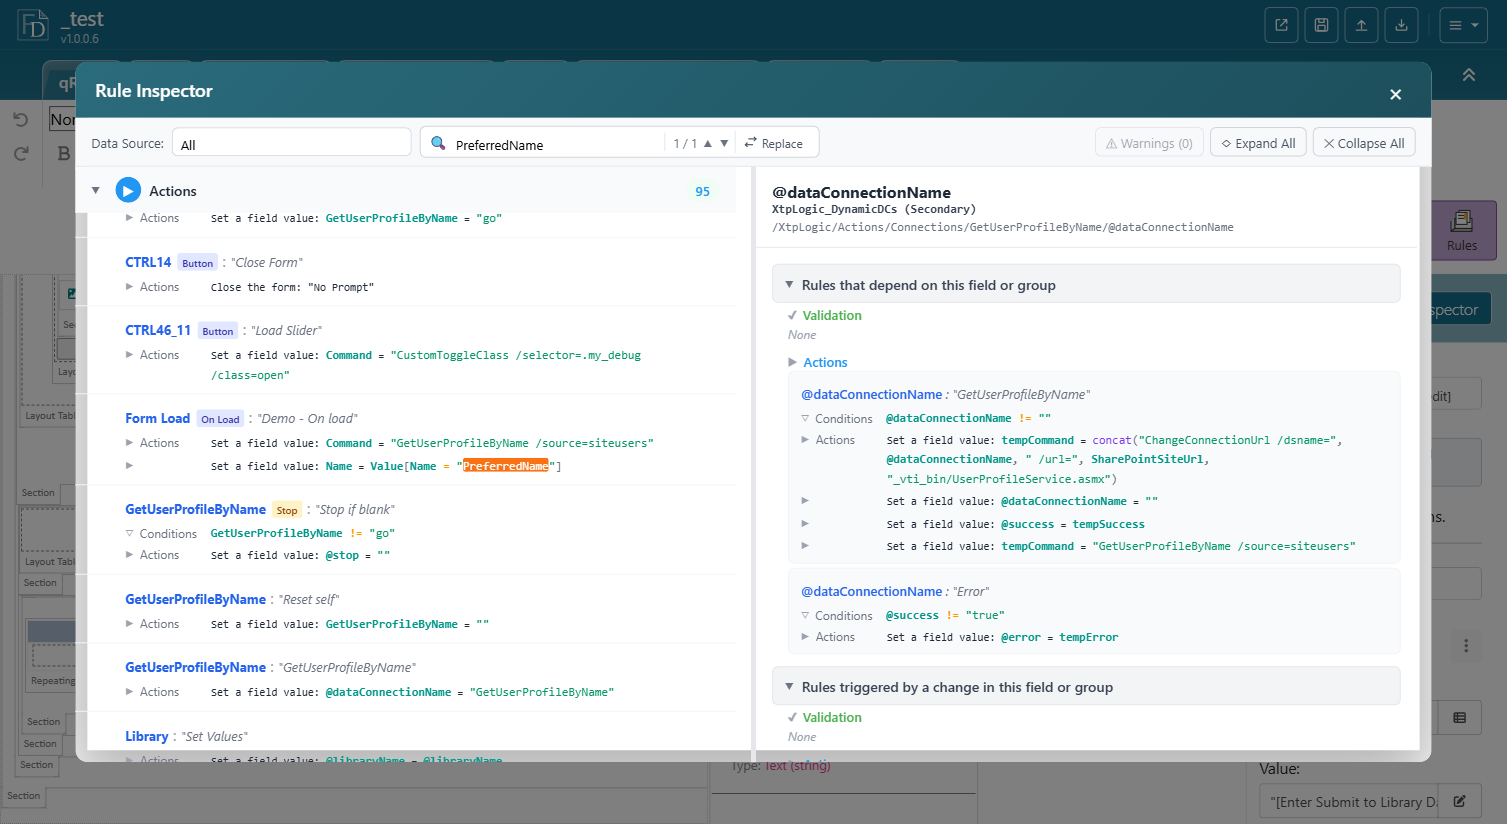
| Search box (Ctrl+F) | Highlights every rule, field, or condition that contains the text and shows a match counter (for example 1 / 1) with next and previous arrows to jump between matches. |
| Replace | Find-and-replace inside rule expressions, for example after renaming a field or a data connection. |
| Warnings (n) | Lists rules the designer flags as problematic. Open it before publishing and resolve what it shows. |
| Expand All / Collapse All | Open or close every node. |
| Tree | One node per rule (owner : "Rule name"), each with its Conditions and Actions, actions shown as Set a field value: target = expression and so on. Owners carry a badge for their trigger: Button, On Load, or none for a field; a Stop badge marks rules with the stop flag. The count next to Actions is the total number of rules. |
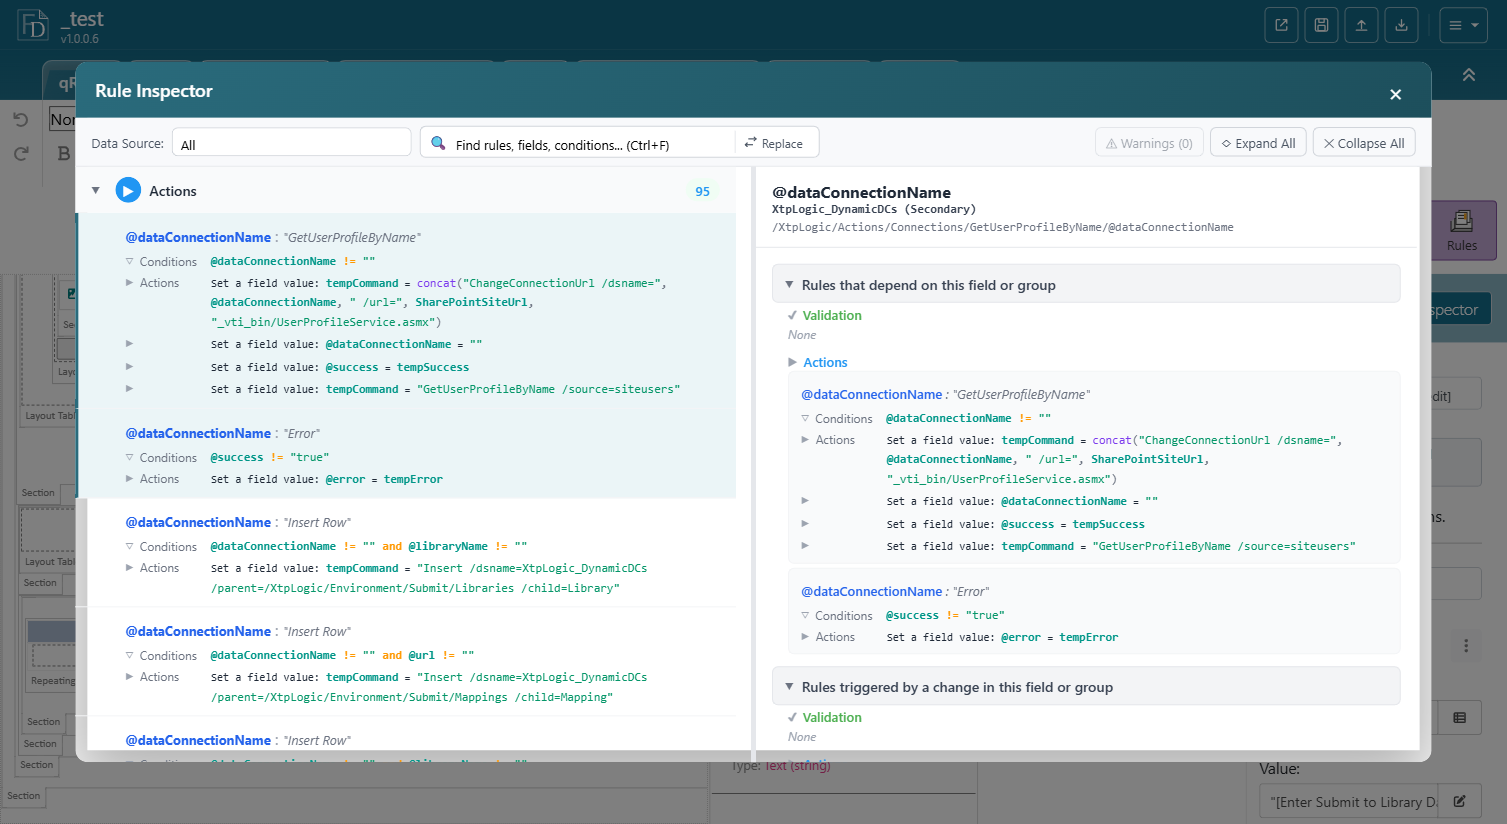
| Right pane | Click an owner name anywhere in the tree. The pane shows the field's full path and two groups: Rules that depend on this field or group and Rules triggered by a change in this field or group, each split into Validation and Actions. |
10.3 Typical uses
Trace a value. Type the field name or a literal in the search box and step through the matches with the arrows. Every occurrence is highlighted in place, so you see each hit in the context of its rule. This is the fastest way to find out why a field changes unexpectedly.
Review start-up order. Set Data Source to QdabraRules and look at the @finishedLoading rules in sequence (Chapter 7 explains why the order matters).
Check before publishing. Open the inspector, click Warnings, fix anything listed, and skim the tree for rules you no longer recognise. Rules left over from experiments are easy to spot here and easy to miss in the per-field pane.
Rename carefully. After renaming a data connection or a field, use Replace to update the rule expressions that still reference the old name, then confirm with Warnings. Replace covers rule expressions only; bindings in the view are not rewritten, so re-check the controls bound to a renamed field on the canvas.
10.4 Reading the tree
- Attributes are shown with
@(for example@dataConnectionName,@finishedLoading). - Conditions appear in their expression form, not the friendly text of the Condition editor, so
Name is blankreads asName = "". - Actions on qRules commands show the full command string, which makes the inspector a convenient place to copy a command from one rule to another.
10.5 Summary
- One place to see every rule in the template.
- Search to trace a field, Data Source to narrow the view, Warnings to catch broken references.
- Make a pass through it before every publish.
Back to Chapter 1.